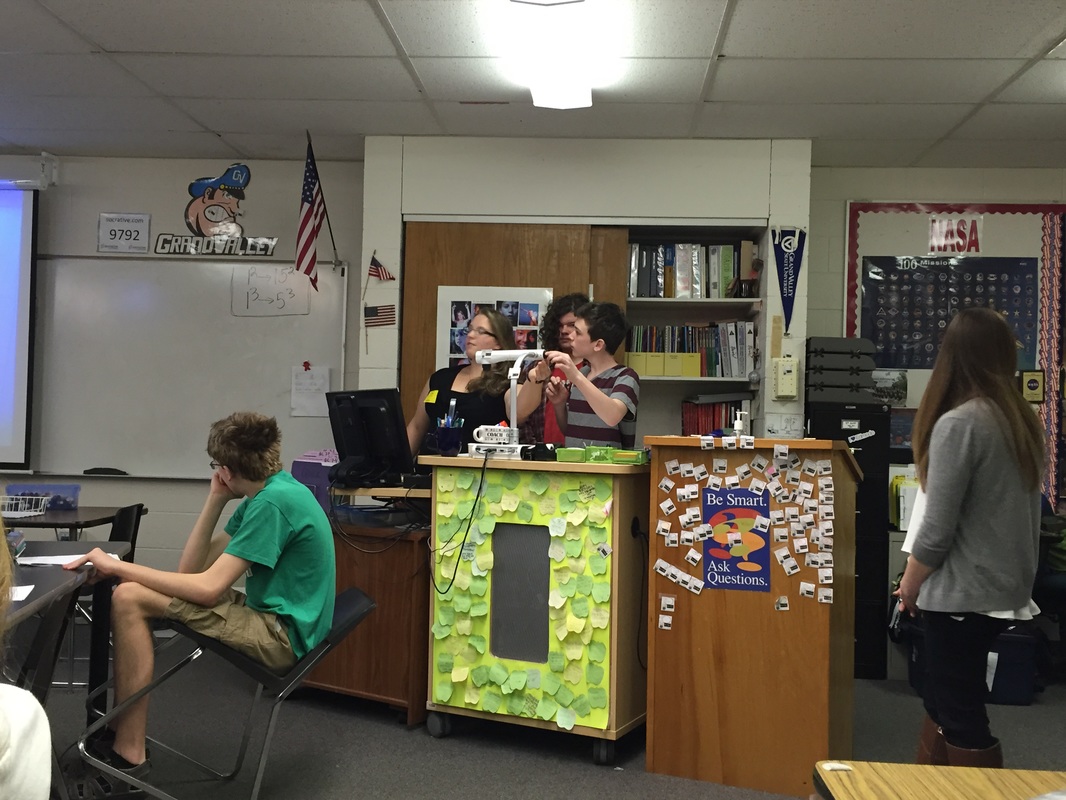
Yet again, Jon Hasenbank brought his students to my classroom. This time, they came and taught for one week. (We did this mid-March, 2016.) He had a rotation set up where most times, GVSU students would observe the day before they came out to teach. Most of the lessons were taught by pairs of GVSU students to my whole class.
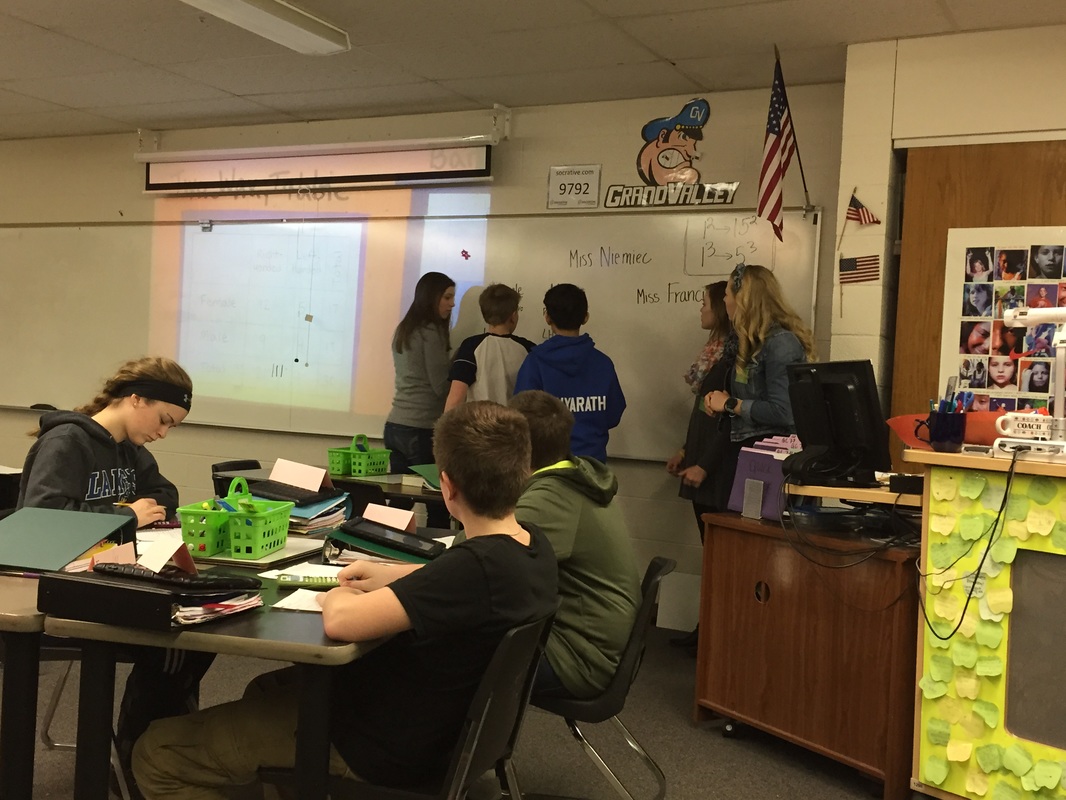
Jon and I decided that his students would focus on the standard, 8.SP.A.4, which has students look at bivariate data and then construct and interpret a two-way table. He broke his students into three groups, giving each group one of my hours of 8th grade math (1st, 2nd & 6th). I would then need to teach my fourth section of 8th grade math during 5th hour. I would piece together the things I liked from 1st and 2nd hour for my lesson. This is both wonderful and extremely stressful all in one package. It's nice to not have to worry about lesson plans but it is not fun walking into work having no idea what plans look like and what materials I'll need to have prepared for the hour. (Good thing I had plan 4th hour that year!)
Each group had the overall same structure but used different examples and twists on activities in class. Here was the overall structure.
Monday: Define and explore what bivariate data looks like and talk about what types of questions are statistical questions.
Tuesday: Learn how to take data and create a two-way table as well as create a stacked bar graph from the data to determine if there is an association between the variables. (Data needed to be collected as homework in some hours for their poster project the next two days.)
Wednesday: Discuss more about association and start a poster project with a team of students (usually 4 students per team).
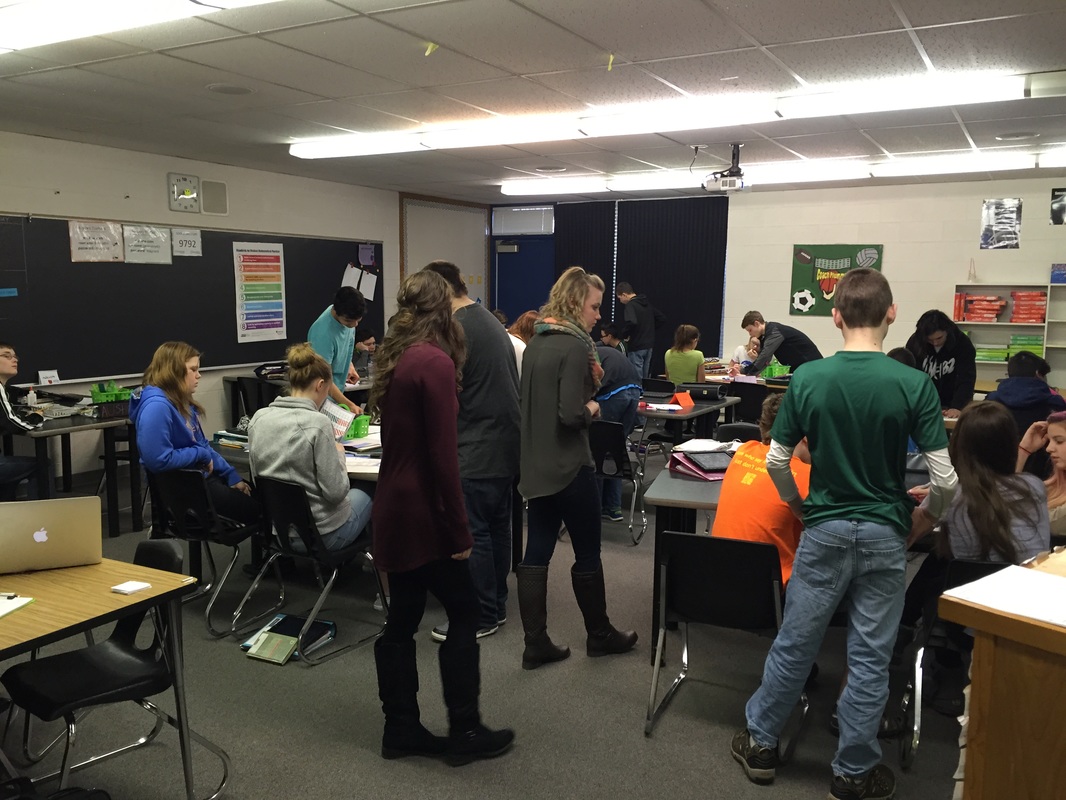
Thursday: Complete poster project & share out using a gallery walk.
Friday: Review all items from the week and take a two part assessment. Part was on paper and part was on socrative.com.
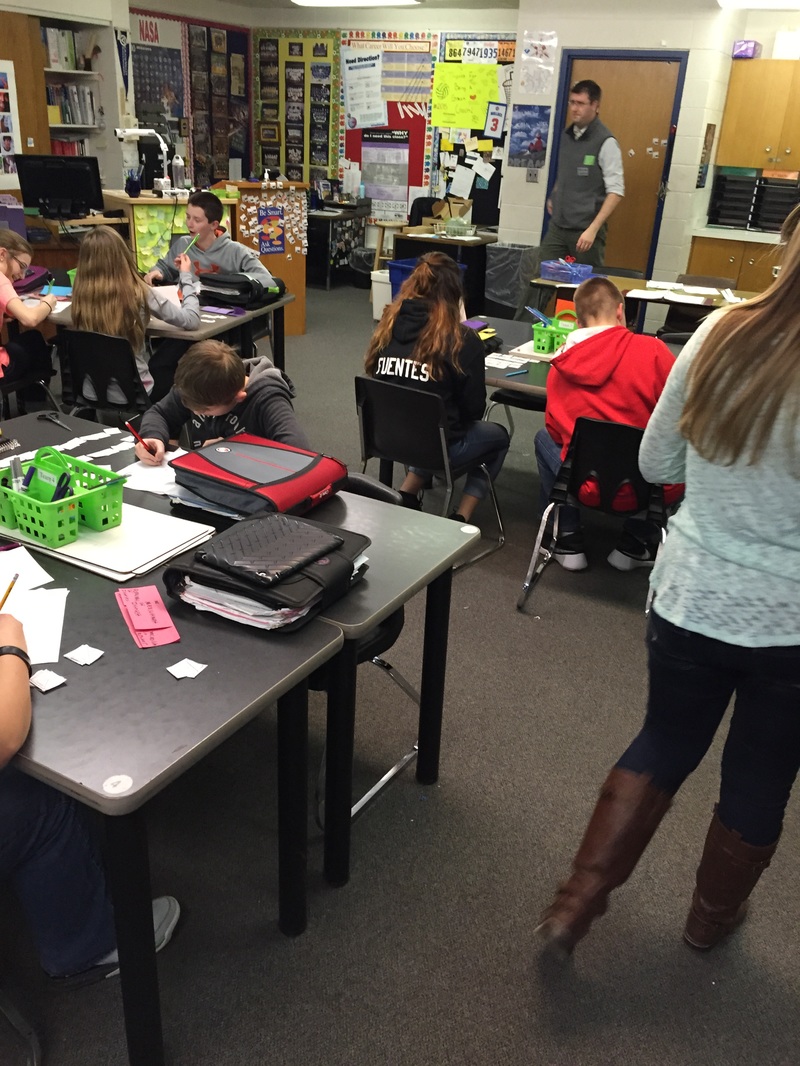
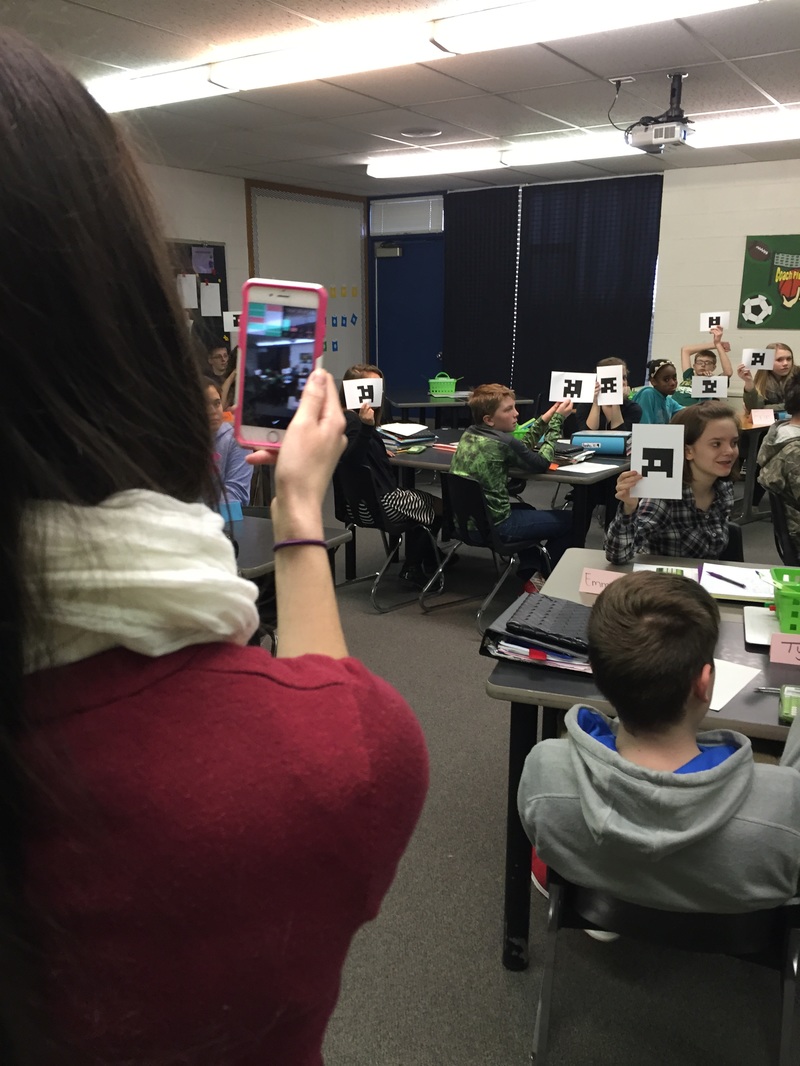
Below are several images from the week. My favorite was the gallery walk that students did to see what other small groups found with their data. Ms. Zilewski, a GVSU student, set up this structure and I loved it! Each team selected two students to stay at their poster and describe their findings to other students from different teams. We rotated 2-3 times so that students we able to hear from a few different groups. We then had team members exchange jobs so that there were new students describing their poster. I really like this because it gave the responsibility of verbally communicating their findings to all group members.
Jon and I decided that his students would focus on the standard, 8.SP.A.4, which has students look at bivariate data and then construct and interpret a two-way table. He broke his students into three groups, giving each group one of my hours of 8th grade math (1st, 2nd & 6th). I would then need to teach my fourth section of 8th grade math during 5th hour. I would piece together the things I liked from 1st and 2nd hour for my lesson. This is both wonderful and extremely stressful all in one package. It's nice to not have to worry about lesson plans but it is not fun walking into work having no idea what plans look like and what materials I'll need to have prepared for the hour. (Good thing I had plan 4th hour that year!)
Each group had the overall same structure but used different examples and twists on activities in class. Here was the overall structure.
Monday: Define and explore what bivariate data looks like and talk about what types of questions are statistical questions.
Tuesday: Learn how to take data and create a two-way table as well as create a stacked bar graph from the data to determine if there is an association between the variables. (Data needed to be collected as homework in some hours for their poster project the next two days.)
Wednesday: Discuss more about association and start a poster project with a team of students (usually 4 students per team).
Thursday: Complete poster project & share out using a gallery walk.
Friday: Review all items from the week and take a two part assessment. Part was on paper and part was on socrative.com.
Below are several images from the week. My favorite was the gallery walk that students did to see what other small groups found with their data. Ms. Zilewski, a GVSU student, set up this structure and I loved it! Each team selected two students to stay at their poster and describe their findings to other students from different teams. We rotated 2-3 times so that students we able to hear from a few different groups. We then had team members exchange jobs so that there were new students describing their poster. I really like this because it gave the responsibility of verbally communicating their findings to all group members.

I loved sitting back and watching the younger teachers gain confidence throughout the hour with the content and working with the students. The students were so flexible and willing to participate that I walked away from that week realizing what great kids we have at Creekside. I've always known that in the back of my mind, but the daily grind sometimes makes me forget how awesome the kids are that I get to see everyday!
 RSS Feed
